Difference between Gantt Chart and Bar Chart
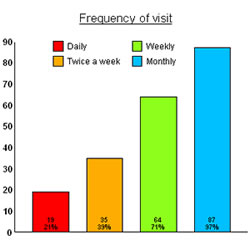
Key Difference: A bar chart consists of a number of vertically or horizontally placed bars and the length of the bars defines the relative magnitude of the values. It uses rectangular bars with lengths proportional to the values that they represent. A Gantt chart is a horizontal bar chart used for project management. It is used to represent the timing of various tasks that are required to complete a project
Charts are used for pictorial representation and thus are widely used for various purposes. Charts are used to project the relevant information in an effective manner. There are numerous kinds of charts that are used and every chart has its own features and uses. One such chart is known as a bar chart. Some people may confuse between a bar and Gantt chart. However, the fact is quiet simple; Gantt chart is simply a type of bar chart. Let us understand the definition of bar charts and then the definition of Gantt chars, and on the basis of these definitions, it will be clear that Gantt is a kind of bar chart.
 A bar chart is also known as bar graph. A bar graph is widely used to compare the items that are displayed. Bar graphs are generally used for data that can be displayed as categorical data, meaning it fits to certain categories. This categorical data is then to be displayed against the amount or frequency of these categorized data. A bar graph is made up of main components like:-
1. Graph title: - it defines an overview of the bar chart.
2. Axis and labels: - every bar graph has two axis and the axis labels indicate that what information is presented using that particular kind of axis.
3. Grouped Data Axis: - it is present at the base of the bars indicating the type of data that is presented.
4. Frequency Data Axis: - it defines the frequency or amount corresponding to the other axis’s data.
5. Axes Scale: - it depicts the range of values presented in the frequency axis.
6. Bars. These are the rectangular blocks and represents data corresponding to one of the data groups.
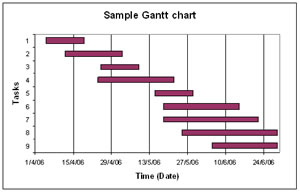
Gantt charts are used to project the relation between the task and the time associated with it. It is a horizontal bar chart which was developed by Henry Gantt in the year 1910. It is mainly used in the field of project management.
Project management deals with scheduling of various tasks and tracking them for the correct implementation. Thus, it is very effective in depicting the work breakdown structure of a project. These charts help in keeping an eye on the various activities and phases of a project.
Gantt chart is a bar chart and thus has two main components-
- A horizontal axis- it is constructed to represent the total time span of a period. This line is broken into increments to depict days, weeks or months. This timeline illustrates when each activity starts, how long it continues, and when it ends.
- A vertical axis- it is constructed to represent all the tasks related to the project. For example software training may require tasks like theory lectures and hand-on training.

Now, the most important element that is used to synchronize the task and the time span is the horizontal bar. It may be of varying length as some tasks may take shorter time than the other. As the project progresses, one can use secondary bars, arrowheads or darkened bars to reflect the completed task, or sections of completed task.
In the image of simple Gantt chart, one can easily see that the tasks are indicated on the vertical line and time is indicated on the horizontal line. The time increments are based on date. The horizontal bars are depicting the relation between the date and the task and thus providing the information that on which date the task started and when it finished off.
Thus, one can easily say that a Gantt chart is a specific type of bar chart that is used in project management. Gantt is a horizontal bar chart thus all Gantt charts fall in the category of bar charts, whereas all bar charts are not Gantt charts.
Image Courtesy: snapsurveys.com, examplesof.com


Comments
Nandha Kumar
Fri, 07/21/2017 - 13:44
Jeswin John
Thu, 11/10/2016 - 07:26
Add new comment