
Difference Between Table and Chart
Key difference: Tables represent facts and figures in a row and column format. Charts represent data in a more graphical manner which may include lines, bars and circles.
 Tables and charts are both used to represent data. However, the manner and circumstances in which each is used, distinguishes them from one another. Tables represent facts and figures in a row and column format which makes the data easier and faster to read and compare. On the other hand, charts represent data in a more graphical manner which may include lines, bars and circles.
 Tables are fairly simple to use, consisting only of a few columns and rows or ordered hierarchies in some cases, such as in a multiplication table. This makes it easier for us to understand, rather than read the data in lengthy sentences. The advantage of tables is that they interact with our verbal system, allowing us to process information in a sequential fashion. We read the data down columns or across rows of numbers. This makes it easier to compare the data side by side. Hence, make it easier for us to understand and to draw conclusions.
Charts, on the other hand, are used to define the relationship between a large quantity of data and its parts. They interact with 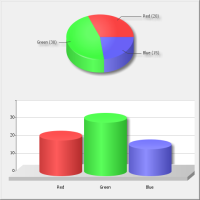 our visual system and make it easier for us to read and understand the data. They give shape and form to the data. Our visual system then perceives the shapes and forms, and deciphers them to extract patterns and relationships among the data. It is believed that a single chart can convey important features of the data more vividly and memorably than columns of data.
our visual system and make it easier for us to read and understand the data. They give shape and form to the data. Our visual system then perceives the shapes and forms, and deciphers them to extract patterns and relationships among the data. It is believed that a single chart can convey important features of the data more vividly and memorably than columns of data.Charts usually do not include long texts. At time, text only appears above the chart describing data that is being referred to in the chart. Data in a graphical chart is usually displayed on a grid scale, consisting of a horizontal x-axis or a vertical y-axis. If the data has multiple variables, the chart may have a legend listing the variables in the chart for easy identification.
A table comparing tables and charts follows:
| Table | Chart | |
| Data Representation | Numbers and text in rows and columns | Graphical representation including lines, bars and circles. |
| Features | Text, numbers, easier to compare data, represents periodic and changeable information, simple to understand | large variety, graphical, little text, pictures, easier to understand, visual in nature |
| When to use | To look up or compare individual values, to show precise values, when multiple units of measure are involved. | To communicate a message that is contained in the shape of the data, to reveal relationship among many values. |
| Types | Simple table, multi-dimensional table, wide and narrow tables | Histogram, bar chart, line chart, pie chart, timeline chart, organizational chart, tree chart, flow chart, cartogram (map), pedigree chart (family tree), bubble chart, stream graph, kagi chart, Scatterplot, etc. |
| Used in | Publishing, Mathematics, Natural sciences, Information technology - software applications and software development. | Mathematics, Natural sciences, Information technology |
 |
 |
 |
 |
 |
 |
 |
 |
Add new comment