Difference between Gantt Chart and Network Diagram
Key Difference: A Gantt chart is a tool used for project management. It is used to represent the timing of various tasks that are required to complete a project. A network diagram is used to define the various tasks of the project in chronological order by using linkages. Both are important tools for project management.
Charts are used for pictorial representation and thus are widely used for various purposes. Charts are used to project the relevant information in an effective manner. There are numerous kinds of charts that are used and every chart has its own features and uses. One such chart is known as Gantt chart. Gantt charts are used to project the relation between the task and the time associated with it. It was developed by Henry Gantt in the year 1910. It is mainly used in the field of project management. A network diagram is also used as an effective tool for defining the tasks. However, there are numerous differences between them. Let us find out the differences between them.
Project management deals with scheduling of various tasks and tracking them for the correct implementation. Thus, it is very effective in depicting the work breakdown structure of a project. These charts help in keeping an eye on the various activities and phases of a project.
Gantt charts have two main components-
- A horizontal axis- it is constructed to represent the total time span of a period. This line is broken into increments to depict days, weeks or months. This timeline illustrates when each activity starts, how long it continues, and when it ends.
- A vertical axis- it is constructed to represent all the tasks related to the project. For example, software training may require tasks like theory lectures and hand-on training.

Now, the most important element that is used to synchronize the task and the time span is the horizontal bar. It may be of varying length as some tasks may take shorter time than the other. As the project progresses, one can use secondary bars, arrowheads or darkened bars to reflect the completed task, or sections of completed task.
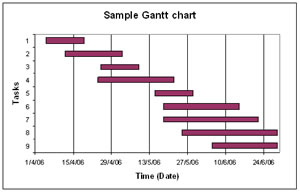
In the image of simple Gantt chart, one can easily see that the tasks are indicated on the vertical line and time is indicated on the horizontal line. The time increments are based on date. The horizontal bars are depicting the relation between the date and the task and thus providing the information that on which date the task started and when it finished off.
However, a very big constraint with the Gantt chart is that it cannot be used to depict the dependencies of task on one another. For example, if a task does not get completed on scheduled time then what will be the impact of this task on other tasks. Therefore, some other types of charts are also used to depict additional information. Still, because of its simplicity and convenience Gantt charts are used and now various softwares are also available that makes the task easier.
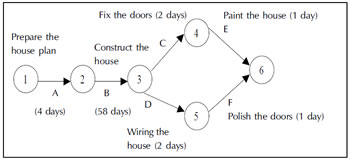
Network diagrams are another important tool for project management. It uses various linkages to show the chronological sequence of various tasks involved in project management. It basically defines the flow-work and can be compared to a flowchart. The tasks are often shown or depicted using a node. The linkages are arrows, that links the tasks and the direction is according to the defined dependency. A sequence of activities from start to finish is known as path. The longest duration path is known as the critical path and also defines the expected project completion time.
Network diagrams are very useful in project planning and control. There are two version of Network diagram. Activity on arrow version is used for projects with many dependencies and emphasizes on events. It is easier to flag the milestones. On the other hand, activity on node version is easier to draw for simpler projects and emphasizes on activities.
It is preferred to make network diagrams for the project and later the Gantt chart. It is easy to make Gantt charts on the basis of these network diagrams. Both are used for visual representation of the key elements of projects also known as tasks. However, they both differ in many senses. Most of the times both are prepared in context to project management. Some key differences have been listed in the table below:-
|
|
Gantt Charts |
Network Diagrams |
|
Definition |
Gantt charts provide a standard format for showing project schedule information by listing project activities and their corresponding start and finish dates in a calendar like format |
A network diagram is a schematic display of the logical relationships among, or sequencing of, project activities. |
|
Tasks |
Visual representation of duration of tasks |
Visual representation of dependencies between tasks |
|
Depicts |
Time overlap between task |
Tasks that can be done in parallel |
|
Slack time |
Visually shows slack time |
Shows slack time by using rectangles filled by data. |
|
Category |
Bar chart |
Flow chart |
Image Courtesy: examplesof.com, wisdomjobs.com


Comments
Paul Weldon
Mon, 10/30/2017 - 16:17
Laxman C Marathe
Tue, 10/24/2017 - 20:14
Olivia Cote
Thu, 09/21/2017 - 16:47
Add new comment