
Difference between Gantt and PERT Chart
Key Difference: Gantt charts and PERT charts are visualization tools that project and breakdown the tasks along with the time it takes to do the particular task. Gantt chart is represented as a bar graph, while PERT chart is represented as a flow chart.
Gantt charts and PERT charts are visualization tools that project and breakdown the tasks along with the time it takes to do the particular task. These are time management tools that are used by managers and administrators to display tasks that are required for project completion. The charts schedule, control and administer the tasks that are set by the manager.
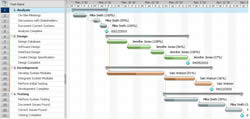 A Gantt chart is a bar graph that was introduced by Henry Gantt and is used to illustrate a project schedule. Gantt developed the chart during the 1910-1915s. The chart shows the start dates, end dates and individually breaks down the project into smaller tasks. Select Gantt charts also show the dependency relationships between activities. This chart is also used in Information Technology to show data that has been collected. A tool similar to this chart was developed in 1896 by Karol Adamiecki and was named harmonogram; however Adamiecki didn’t publish his chart until 1931 and even then only in Polish, limiting its adaptation in other countries. Gantt charts have become a popular tool in many companies around to world as a work breakdown structure (WBS) chart.
The chart shows a horizontal bar which represents the task, while the length of the bar shows the time required to complete the task. On an x-y axis, the x axis represents the time for project completion. Independent tasks are connected using arrows, which show the relationship between two independent tasks. The relationship stems from the dependency of one task on another, where one task must be finished in order to being the other task. A limitation of the Gantt chart is that they do not efficiently represent the dependency of one task to another. Gantt charts are also limited to small projects and are not effective for projects with more than 30 activities.
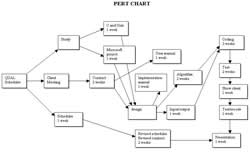 The Program Evaluation and Review Technique (PERT) chart is statistical tool that is used in project management that is similar to the Gantt chart. This chart is a flow chart. PERT charts are also designed to analyze and represent the tasks involved in completing a given project. They were developed by the United States Navy in the 1950s and are commonly used with the critical path method (CPM). The PERT chart also analyzes the various different tasks involved in a project and the time it will take to complete each task and subsequently the whole project. PERT was initially developed to simplify the planning and scheduling of large and complex projects. It was designed for the US Navy's Polaris nuclear submarine project.
PERT charts can manage large projects that have numerous complex tasks a very high inter-task dependency. The charts have an initiation node, which further stems into a network of individual tasks. PERT chart are popular for projects that require an assembly line and also represent the relationship between different tasks that are required to complete the project. The PERT chart has numerous interconnecting networks of independent tasks. The events in a PERT chart are in logical sequence so that no other task can begin until the previous task is completed. A PERT chart may have multiple pages with many sub-tasks. PERT chart is useful when trying to manage multiple tasks that will occur simultaneously. This chart is a bit complicated to use and are often used with Gantt charts in order to simplify the tasks better.
Image Courtesy: projectmanager.com, molinaedgar.blogspot.com
 |
 |
 |
 |
 |
 |
 |
 |
Comments
Useful information . Thanks
Zulqarnain Shafqat
Tue, 02/10/2015 - 13:59
Add new comment