Difference between Gantt Chart and Flowchart
Key Difference: A Gantt chart is a tool used for project management. It is used to represent the timing of various tasks that are required to complete a project. Gantt chart may also be used to mark key events known as milestones and therefore in this context, the Gantt chart is also referred as a milestone chart. A flowchart is used to represent a logic sequence or an algorithm and is implemented by using geometrical symbols and arrows to define the relationships.
Visual graphical representations always appeal more than texts or simple tables. Charts and diagrams are important tools for representing the information in a graphical manner. Flowcharts and Gantt charts may seem to be the same thing but they are quiet different from each other. A Gantt chart does not fall in the category of the flowchart as it is a bar chart. On the other hand, a flow chart is completely different from a bar chart. Let us explain them in details.
Gantt charts are used to project the relation between the task and the time associated with it. It was developed by Henry Gantt in the year 1910. It is mainly used in the field of project management. Project management deals with scheduling of various tasks and tracking them for the correct implementation. Thus, these charts are very effective in depicting the work breakdown structure of a project. These charts help in keeping an eye on the various activities and phases of a project.
Gantt charts have two main components-
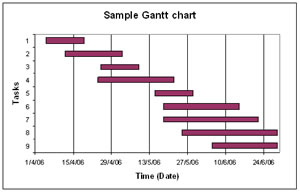
- A horizontal axis- it is constructed to represent the total time span of a period. This line is broken into increments to depict days, weeks or months. This timeline illustrates when each activity starts, how long it continues, and when it ends.
- A vertical axis- it is constructed to represent all the tasks related to the project. For example, software training may require tasks like theory lectures and hands-on training.

Now, the most important element that is used to synchronize the task and the time span is the horizontal bar. It may be of varying length as some tasks may take shorter time than the other. As the project progresses, one can use secondary bars, arrowheads or darkened bars to reflect the completed task, or sections of completed task.
In the image of simple Gantt chart, one can easily see that the tasks are indicated on the vertical line and time is indicated on the horizontal line. The time increments are based on date. The horizontal bars are depicting the relation between the date and the task and thus providing the information that on which date the task started and when it finished off.
Flowcharts are used in various fields like computer programming, project management, etc. The flowcharts define the various processes and the sequence that is followed by the processes. Flowchart uses geometrical symbols like:-
- Rectangle: it describes a particular process or task
- Oval: it describes the end or the finish point
- Round: connector represents the exit to, entry to or another part of the same flowchart.
- Diamond: it is used as a decision symbol. A single entry to the symbol may lead to any number of exit solutions.
- Arrows: the lines with arrows are used to depict the flow through the chart
Apart from these basic symbols, many other symbols are also used to define the flowcharts. Many standards have been established, but still people use flowcharts according to their convenience.
Thus, we can conclude that Gantt chart is completely different from the flow chart. Some key differences have been listed in the table below-
|
|
Gantt Chart |
Flow Chart |
|
Definition |
A bar chart to project the relation between the task and the time associated with it |
A diagram that depicts the nature and flow of steps involved in a process |
|
Graphic symbols |
Horizontal bars |
Various geometrical symbols like rectangles, oval, etc |
|
Usage |
Mainly in project management |
designing and documenting complex processes in any field |
|
Advantages |
Excellent tool for depicting milestones and resources scheduled to time, used in status reporting, simple presentation format |
Promote process understanding, Provide tool for training, Identify problem areas and improvement, opportunities, Depict customer-supplier relationships |
|
Focus Area |
Time taken to complete a task |
Sequencing of tasks or processes |
|
Representation |
Linear |
Can have parallel or interconnecting networks of tasks |
Image Courtesy: examplesof.com, indira-pfc.blogspot.com


Add new comment